


We define a new metric – the Cost of National Defence Index (CNDI). The Armed Forces Sizing Index (AFSI), proposed earlier showed the minimum of one soldier supporting and supported by 1,000 citizens should be the sizing threshold for design of a nation’s military. Further, we showed from the data that the Indian military and thus the Indian soldier is the only major military force that is close to the minimum threshold. The AFSI was discussed at https://www.indiandefencereview.com/news/is-the-indian-soldier-overloaded-right-sizing-the-armed-forces/. This article is a continuation of our effort to develop a comprehensive model for a nation in general and India in particular, for the design of a commensurate, affordable and sufficient armed forces.
We wrote in the AFSI article, “This analysis neither takes into account the economics nor the affordability of such a force. It does not include the level of GDP, technological factors, threat levels and doctrinal innovation either.” To include the level of GDP along with the AFSI, we propose and have developed the CNDI metric. Besides the GDP, this metric takes into account, the respective defence budgets of nations as available in IISS Military Balance. The defence budgets of various countries are not incorporating the same inputs. For example, India includes pensions into the budget. Not so in China or the United States (US), and most other countries. Similarly, China does not include the construction of accommodation for the PLA or the communication infrastructure into their defence budget. Obviously, the variations and definitions of defence budget of various nations are not consistent and same.
For that matter, GDP figures as well. In the 2014 book, “GDP – A brief but affectionate history”, Diane Coyle says, “GDP is the way we measure and compare how well or badly countries are doing. But this is not a question of measuring a natural phenomenon such as landmass or average temperature to varying degrees of accuracy. GDP is a made-up entity.” The author further states, “GDP is an abstract statistic derived in extremely complicated ways, yet one that has tremendous importance.” If GDP computation and its ‘design’ by different nations are not really consistent and ‘accurate’, the defence budget of a nation can never be indeed. However, within the constraints of statistical wizardry of various stakeholders, we accept that these published figures do give us a semblance of some direction indeed.
The CNDI proposed in this article is an integrated metric that combines key indicators of a country’s economic progress and the design of its armed forces commensurate with its economic situation. This is a novel approach and a new metric to measure the integrated view of a nation. Of the 15 countries for which we calculated the CNDI for five years of 2009, 2014, 2020, 2021 and 2022, India’s CNDI is the maximum at an average of close to 20. This we propose is not sustainable for the long term and India needs specific strategic and policy design measures to balance the factors contributing to the CNDI. We suggest few pointers in this article. Before, however, we define and discuss the CNDI.
A Macro Model
There are four key factors at the macro level that one needs to consider to find the picture of affordability of Military by a nation:–
-
- Gross Domestic Product (GDP) per year in USD terms (G)
- Population of the country (P)
- Defence Budget that is allocated/spent per year in USD terms (D)
- Number of active soldiers that the nation is maintaining per year (S)
- First, we define two simple ratios
GDP per Capita is a well-known, G/P. It supposedly provides a truer picture of economy of a country, despite all the issues in how GDP is computed and the availability and manipulation of data that goes into estimation and declaration of GDP;
Defence Budget per Active Soldier is a new metric proposed (D/S) to indicate the type of military force that is being maintained. The assumption being if this ratio is higher, i.e., nation spend more on defence and maintain a specific number of military manpower as active soldiers, it needs to balance this ratio not only from the number of active soldiers’ perspectives but also their equipment, weapon systems and support systems. We consider the defence budget to be a surrogate for the weapons and technology. How effective and how lethal these systems are not being considered explicitly as of now in our model.
Next, we define the CNDI which is the ratio of the two metrics defined above, ratio of Defence Budget per soldier and GDP per capita.
CNDI = Defence Budget per Soldier (in USD) terms/GDP per Capita (in USD) terms, i.e.:
CNDI = (D/S)/(G/P)
Cost of National Defence Index (CNDI)
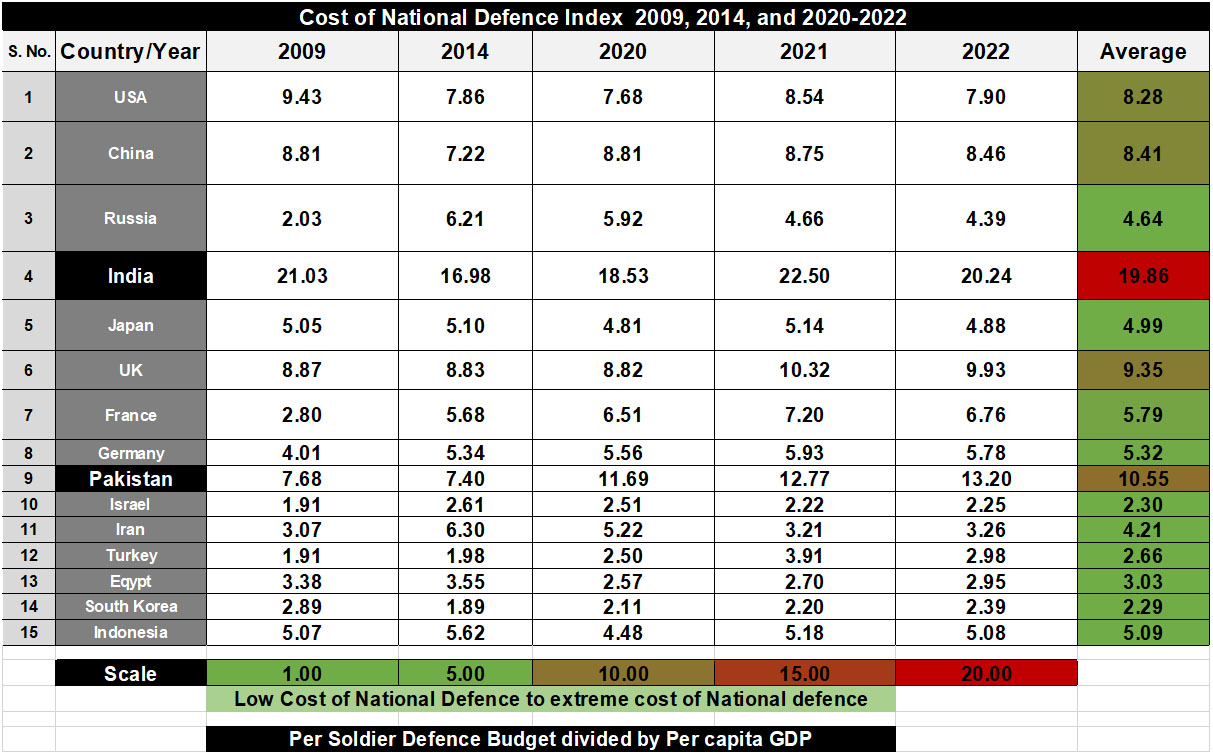
We have computed below the CNDI for 15 countries of interest including US, China, Russia, Pakistan, United Kingdom (UK), France, Japan, Turkey, Israel and of course India, for the years 2009, 2014 and three contiguous years 2020-2022, using IISS Military Balance data. The higher this factor, the greater is the cost of national defence. It is a clear indicator that if you want to have national defence capability affordable for your size, you need to have GDP commensurate to your population. Otherwise, the load on the population and the economy to maintain the oversized national defence will be non-affordable and will have serious consequences of sustaining your economy as well as national defence. The underlying axiom is that every nation has to balance the maintenance of cost-intensive military force and capability with the economic growth of the nation.
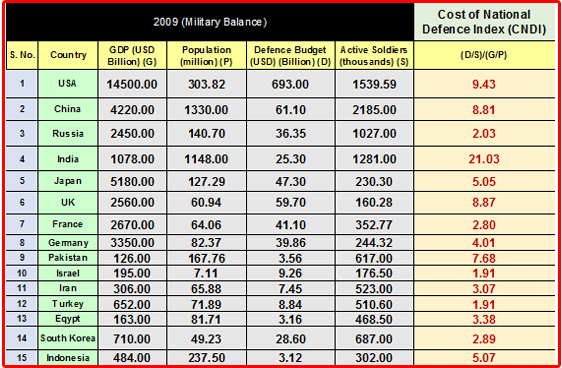
As one can clearly see from the data above, of all countries in the year 2009, India has the highest CNDI, i.e., 21.03. The index can be interpreted as 21.03 citizens yearly earnings in the year 2009 went to the upkeep of one soldier and his associated military equipment and systems. This is the highest cost in our data for 15 key countries. CNDI for US, China, UK and Pakistan are below 10.0 as can be seen in the table.
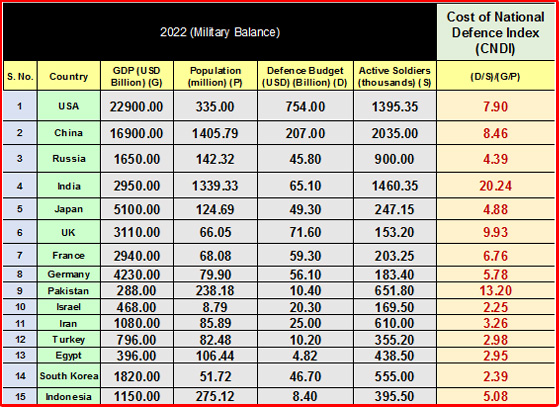
Next, let us study the CNDI for the year 2022 below. It can be seen that the CNDI for India continues to be above 20 although it has come down slightly compared to what it was in 2009. But for others, e.g., the US it has come down from 9.43 to 7.9, while for China it has reduced slightly from 8.81 to 8.46. If it is of any consolation, one can point out that for Pakistan it has increased from 7.68 to 13.20. But still, it is much below India’s CNDI which is above 20.
We computed the CNDI for 15 nations for few intermediate years as mentioned, which we will present in the last section. Before we present and analyse the CNDI, let us study the evolution of the constituent metrics and their interrelationship.
Defence Budget (USD terms) per Soldier Vs GDP (USD) per Citizen
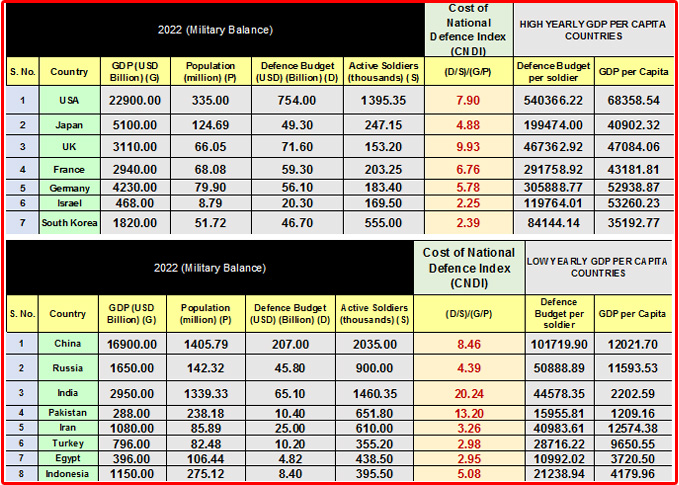
We divided our list of 15 countries into two sets – one set contains those nations which have high GDP/capita – the seven countries are included in this list – USA, Japan, UK, France, Germany, Israel and South Korea.
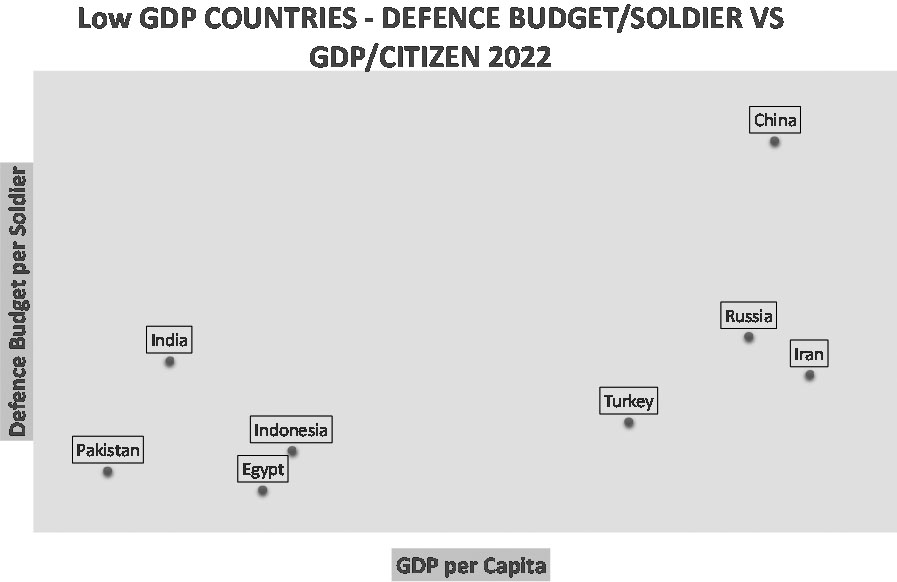
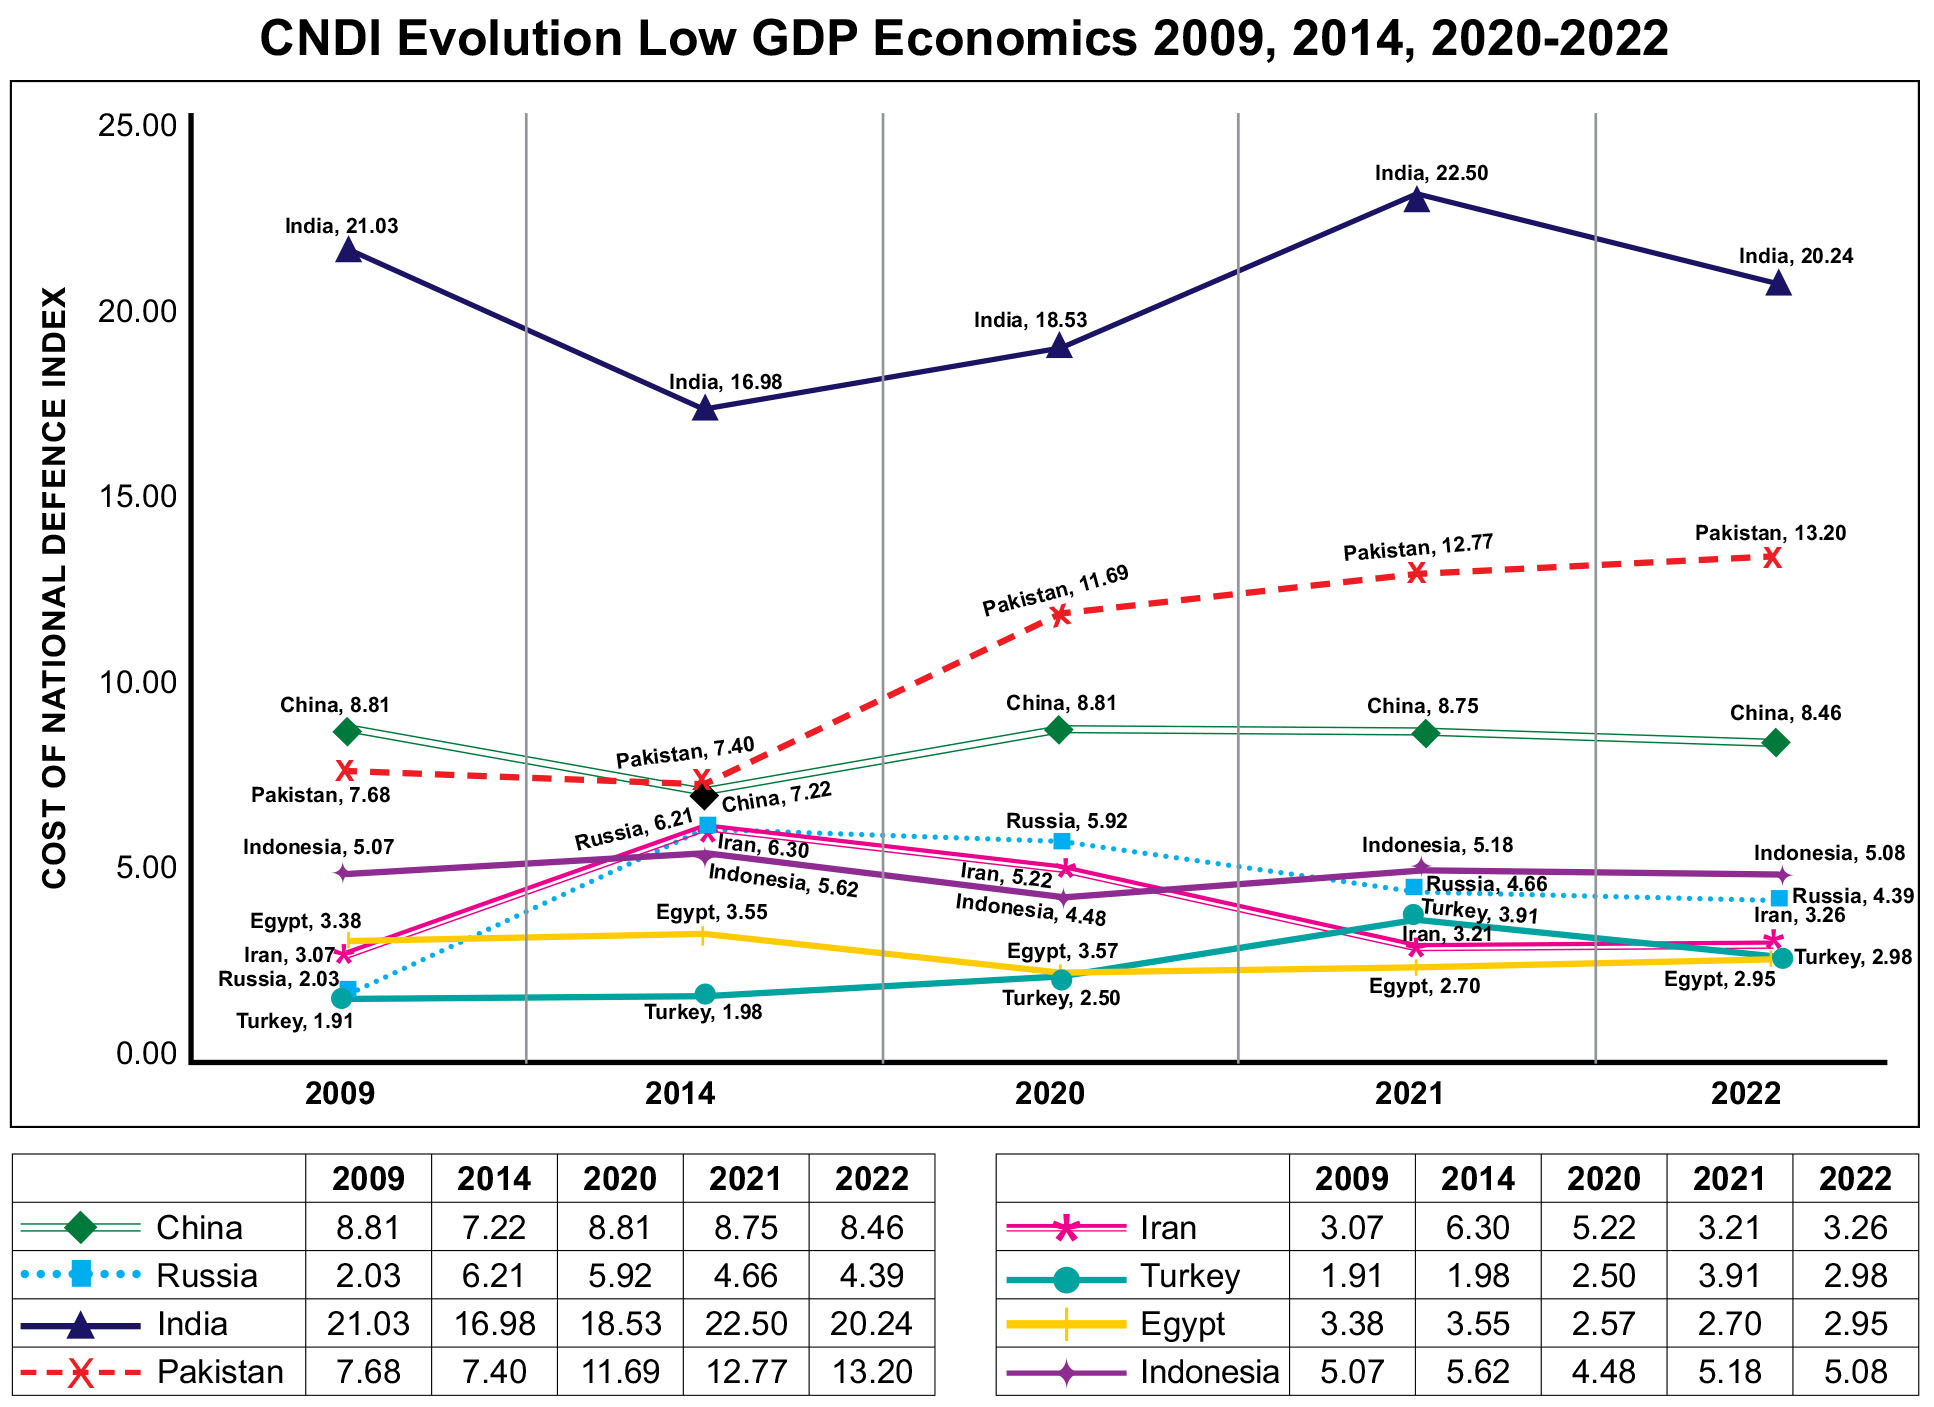
For 2022, the yearly GDP per capita of these countries was above 40,000 USD. The remaining eight countries, namely – China, Russia, India, Pakistan, Iran, Turkey, Egypt and Indonesia, had relatively low yearly GDP per capita countries. We also present plots of the two metrics that constitute the CNDI, i.e., GDP per capita and Defence Budget per Soldier. GDP/Capita is on X-axis and Defence Budget/Soldier is at Y-axis. Plots are for year 2022. We show below the 2022 data for high GDP and low GDP countries in our list in two different tables and also plot their GDP/capita with Defence Budget/Soldier in the charts that follow.
The Evolution of CNDI (2009, 2014, 2020-2022)
 Below we present the evolution of the CNDI i.e., ratio of Defence Budget per Soldier and GDP per capita. CNDI calculated and presented are for 2009, 2014 and three more years 2020-2022. It can be seen that Indian CNDI was at 21.03 in 2009. That means 21 citizens earnings had to support one soldier and the related defence equipment, weapon systems, for India. In fact, this ratio is highest for India in 2009, compared to all other countries in our list. Contrast this number to say Pakistan, which indicates ten citizens supporting one soldier and defence budget for Pakistan. In 2009, 7.68 citizen earnings were supporting a Pakistani-Soldier and Defence dollar spent. The 2014 data shows that as Indian GDP/Capita grew in 2014, the CNDI reduced to 16.98. This is substantial reduction. However, in 2020 CNDI for India is 18.53 and thereafter, it has been around 20. Taking the average CNDI of all five years, it is clear that India has been at 20 while all others have been below the CNDI of ten except Pakistan which is having an average CNDI of 10.55.
CNDI is a macro-indicator of holistic and integrated nature of national defence and national growth. India has not balanced it at all, that is clearly indicated in the charts from 2009. China and even Iran are progressing towards the right higher per capita GDP and also building a national defence with commensurate and affordable defence budget per soldier. They have done this by balancing technology investment, doctrinal and force structural changes by reducing the pure manpower-driven forces; of course, also increasing their per capita GDP through economic upliftment of their population.
It is greatly instructive for India which is the key result from the analysis. India stands alone with unsustainable cost of national defence as reflected in the CNDI. With an average of 20 times per capita GDP, it spends highest for defence per soldier which is highest in the world, in the list of 15 major nations that we considered.
 Conclusions and Re-design of Indian National Defence
We have four levers to re-design our policies for national economic growth as well as national defence – increase GDP, manage population, manage defence budget, manage armed forces numbers. Obvious isn’t it!
What we can however see through the new metric of CNDI is not so obvious and trivial. The cost of not doing a holistic and comprehensive analysis and policy design based on these entangled four levers. We have to design an India where the CNDI is systematically reduced by balancing technology in defence budget, managing the number of armed forces personnel we need, leveraging and maximising the potential of our young population in a way that the GDP per capita is increased. The holistic policies are needed else we will be in an unsustainable mode.
We can optimise by defining the capability and developing effectiveness through a combination of innovative means at technology, doctrine, force design and strategic design including diplomacy. Obviously, the criticality of the problem is not considered as a crisis leading to potential disaster as the design by our foes namely China, friends such as Russia, fair-weather friends such as the US and interest-based friends such as France has not been read holistically by us and response has been piece-meal, contextual, transactional and reactive to say the least.
We need a proactive design for India. First, the objective should be clearly considered. Secondly, the teeth-to-tail ratio needs to be considered from the type of teeth that are needed and can be made available in new tech warfare. These of course should include cyber and Electronic Warfare (EW). The tail of armed forces in the new warfare may actually be the new teeth. The Indian armed forces need to design and develop teeth from what has traditionally been considered the tail. We believe, there is fundamentally a design approach issue. If we have to begin, let us begin with holistic thinking and understanding. Create the structure of the whole design with multiple impact analysis carried out. Then one can prioritise. However, in the absence of any national security architecture or design of national security doctrine, we will continue to be blind men exploring an elephant. Perhaps CNDI metric, proposed above, can actually show us the type of elephant the Indian economic system is and what type and form it should take ahead.
Acknowledgement
The author is indebted and would like to acknowledge and thank Lt Gen JS Bajwa, for the editorial remarks and inputs which have improved the article and potentially clarified very specific gaps for readers of the article.
 Please wait...
