


The Indian economy has been an outlier in terms of growth, clocking a 7.1% increase in GDP during 2022-23, and is expected to achieve 6.5% growth in 2023-24. Agriculture has proved to be a robust sector, registering an average growth rate of 3.5%, and most importantly provided much-needed food security when nearly 50 million migrant workers were hapless and jobless during the pandemic. Services, the worst affected, with an 8.4% dip during 20-21, has also got back its growth rate of yesteryears, 9%. However, the advanced estimates of CSO clearly bring out manufacturing, which is the primary springboard for employment shows tepid growth of only 1.6% during this financial year.
It is indeed in this backdrop it would be interesting to analyze the major thrust areas of this year’s budget, allocation to the defense services, and to what extent the various pronouncements made for improving the self-reliance index and modernizing our defense services with a view to keep our adversaries at bay. In this context, it needs to be brought out how total military spending has touched US$2.1 Tn marking showing a decline of 0.7% over the previous year’s expenditure as per SIPRI Yearbook (2022) data. The USA accounts for 38% of global military spending and 60% of R&D spending. This clearly explains the edge the USA has in terms of military arsenal and cutting-edge military technology, which often has the dual-use capability. It is also the leading exporter of conventional arms while India leads the pack as the largest importer. The following table will bring out the trends in global imports and exports.
Table 1: Trends in Global Imports & Exports
| Country | Export % | Country | Import % |
| USA | 39% | India | 11% |
| Russia | 19% | Saudi Arabia | 11% |
| France | 11% | Egypt | 5.7% |
| China | 4.6% | Australia | 5.4% |
| Germany | 4.5% | China | 4.8% |
| Italy | 3.1% | Qatar | 4.6% |
| UK | 2.9% | S Korea | 4.1% |
| S Korea | 2.8% | Pakistan | 3% |
Source: SIPRI (2022)
Quite clearly USA, Western Europe, and Russia dominate the export landscape while countries like China and South Korea are both importers and exporters. Military expenditure globally constitutes 2.2% of global GDP. In India, if we include the pension element around 2% of India’s GDP is spent in the defense sector. Unlike global trends, the defense allocation shows a hefty increase of 15% for the upcoming FY. Despite humungous allocations made to the defense sector, the services feel aggrieved that they have always received 13%-23% less than what had been proposed to the MoF. In macro terms, the services want around 3% of GDP, while the allocation hovers around 2%.The following table will bring out the allocation shortfall by the MoF.
Figure-1 : Allocation Gap of the Ministry of Defense, 2017-18 – 2022-23
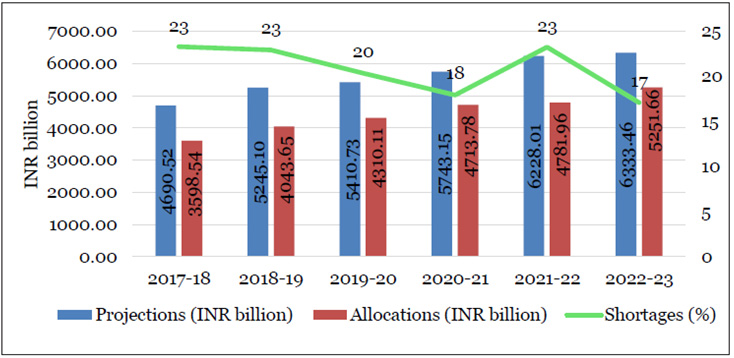
Source: Author’s own, using data from Standing Committe on Defence, 26th Report.
While such a shortfall might give an impression that the defense services are generally deprived of funds which can impinge on their operational preparedness, the reality is that allocation has never been an issue in the event of operational need. Also, the trends mask the surrender of funds by the three services in the acquisition of platforms and systems as part of CAPEX.
The distribution of MoD’s budget this year and the allocation for next FY is given below:
Table-1: Distribution of MoD’s Budget (2022-23 & 2023-24)
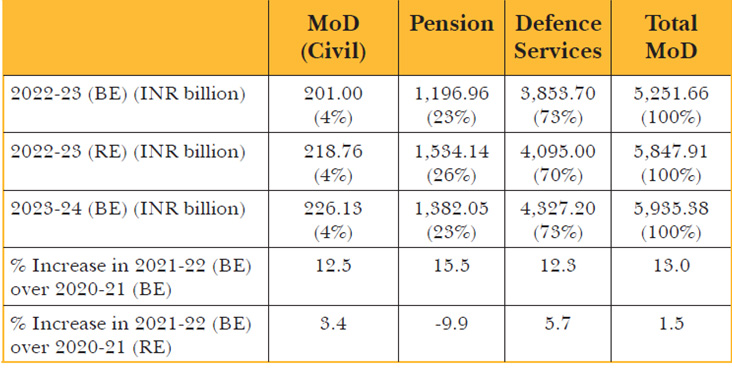
Source: Author’s own, based on Union Budget 2023-24. Note: BE and RE represent Budget Estimate and Revised Estimates, respectively: Percentage figures in parentheses show the respective share in MoD’s total.
The following table will bring out the share of revenue in capital expenditure for the services
Table-2: Shares of Revenue and Capital in MoD Budget 2023-24
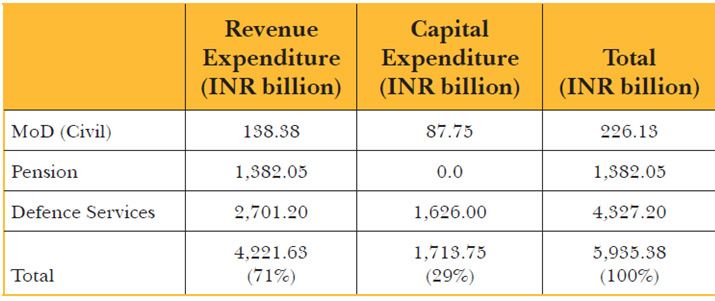
Source: Author’s own, based on Union Budget 2023-24.
It would thus be seen that capital expenditure accounts for 30% of total defense allocation. This is significantly higher than the capital expenditure earmarked in the general budget which is around 22%. (10 lakhs cr / 45 lakhs cr). Incidentally, the capital expenditure budget has witnessed a whooping increase of 33% over the previous year’s allocation.
The following figures bring out respective shares of different services.
Figure-2: Amount (INR B) and Shares (%) of Defense Services 2023-24
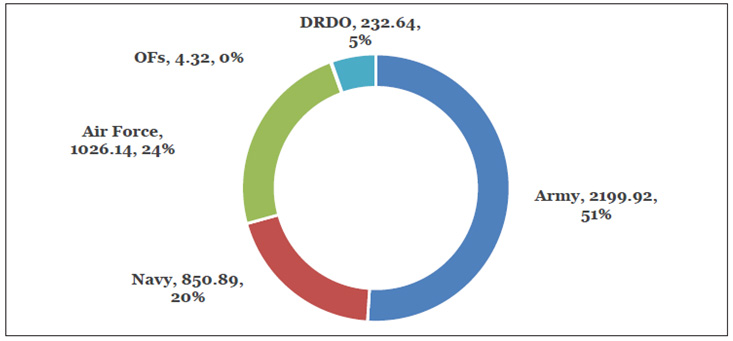
Source: Author’s own, based on Union Budget 2023-24. Note: The Total of all defence services excludes the INR 13.10 billion capital outlays earmarked for ‘Investement in Public Enterprises’, and INR 0.20 billion for capital expenses of Director General of Quality Audit.
Quite clearly Army is a major spender 51%, with sizeable revenue spending, while the IAF is capital intensive, closely followed by the Navy. The 39 Ordnance factories have now become Public Sector Enterprises (PSEs) as a part of the structural overhaul. DRDO, with 40 laboratories spends 5% of the Defence budget. The standing committee on Defense (1996) suggested that ideally, the DRDO should spend 10% of the Defence budget to reduce India’s dependency on imports and bolster indigenous capability to manufacture critical subsystems like weapons, sensors & propulsion.
The following table brings out the share of the services in the revenue & capital budget.
Table-3: Shares of Revenue and Capital of the Armed Forces 2023-24
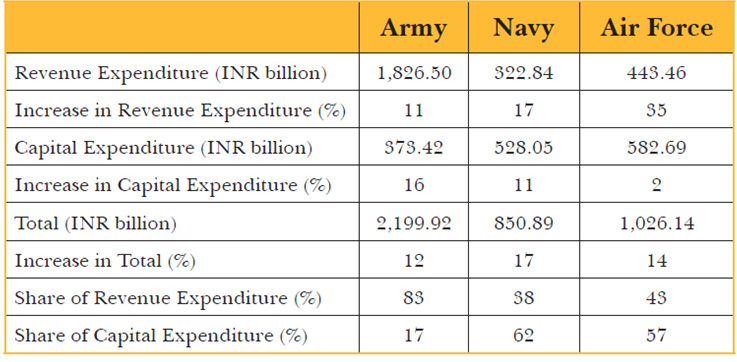
Source: Author’s own, based on Union Budget 2023-24.
It would be seen from the above that while the overall increase is 14% for 2023-24, there are sharp differences between services both in terms of revenue and capital allocation
The following table brings out the disaggregated picture of allocation to modernize the three services.
Table-4: Armed Forces Modernization Budget
*Approximate Figures. Source: Author’s own, based on Union Budget 20232-4.
The following table brings out the capital budget shortfall of the services, due to MoF’s disapproval.
Table-5: Resource Constraints in Defence Capital Acquisition (2022-23)
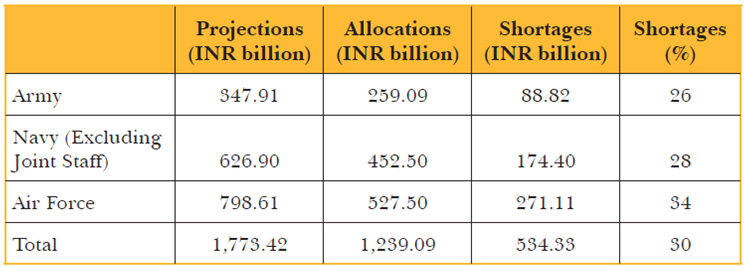
Source: Standing Committee on Defence, 28th Report.
The following table brings out the key statistics of the defense budget
Table-6: Key Defense Budget Statistics
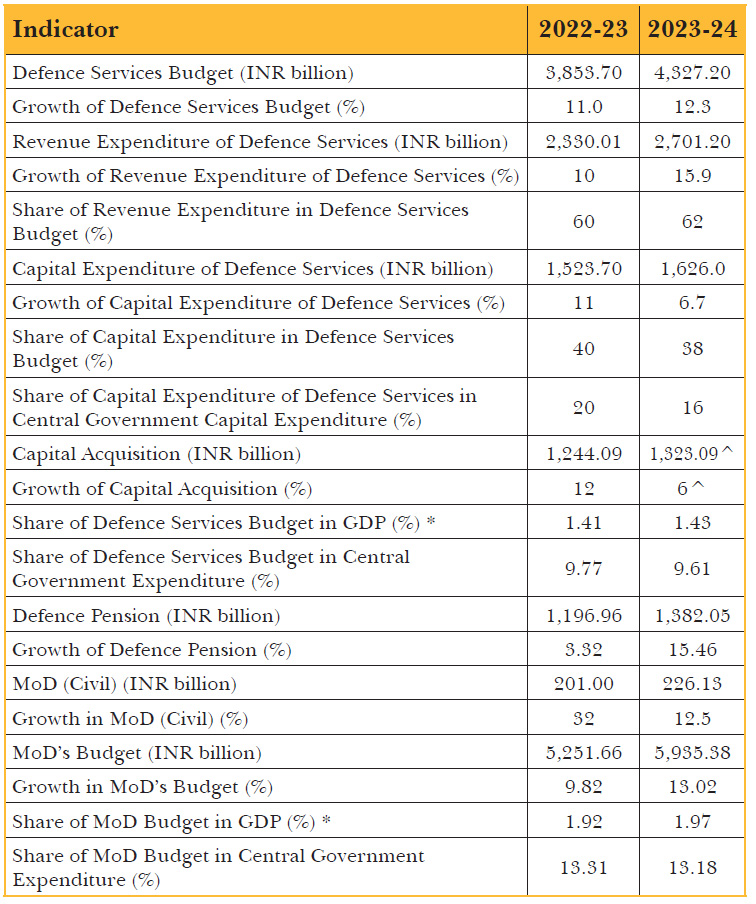
Note: *GDP figures for 2022-23 and 2023-24 are first advance estimates and budget estimates, respectively: ^ Approximate figures. Source: Source: Author’s own, based on Union Budget 2022-23 and 2023-24.
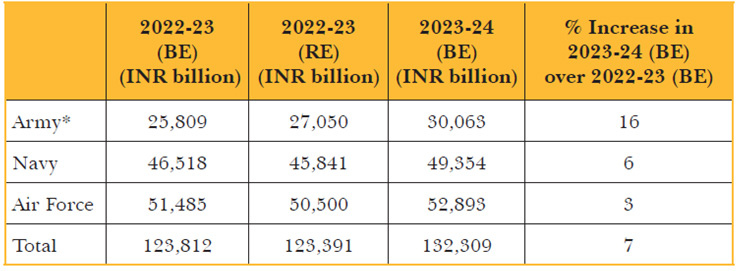
The following tables bring out the disaggregated picture of the modernization budget of the three services
Table-7: Modernization Budget of the Indian Army
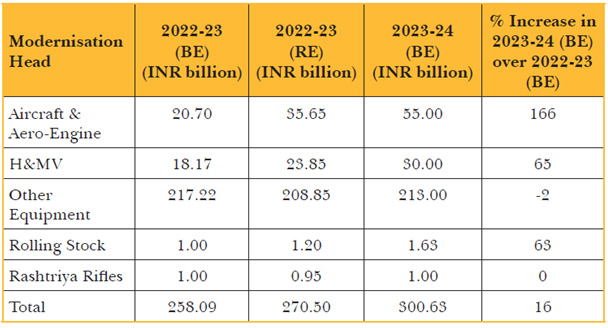
Note: Figures for Army are approximate. Source: Source: Author’s own, based on Union Budget 2023-24.
Table-8: Modernization Budget of the Indian Navy
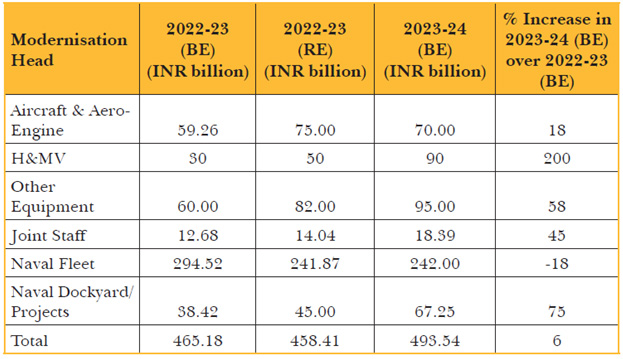
Source: Author’s own, based on Union Budget 2023-24.
Table-9: Modernization Budget of the Indian Air Force
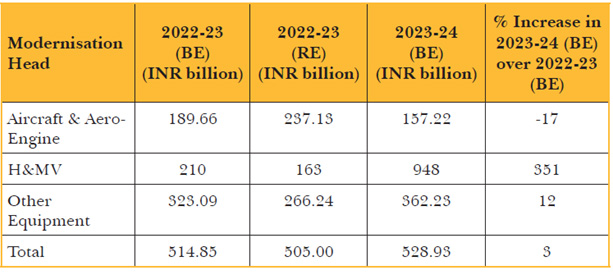
Source: Author’s own, based on Union Budget 2023-24.
Reforms & Initiatives for Make in India in Military Industry Complex
While economic liberalization was embraced by different sectors in 1991, the first economic reforms in defense services were introduced in 2001 by allowing full private sector participation and 26% FDI. The Kelkar Committee in 2005 strongly pitched for Public Private Partnership and provided a level playing field to the private sector companies. The Committee also recommended that the offset policy should be introduced which will India to leverage its Big BUY acquisition to harness FDI inflow, outsourcing orders, and technology. This is in the backdrop of the 1956 Industrial Policy Resolution which gave exclusive rights to Defense PSUs to manufacture missiles, electronics, submarines, and aircraft, and the Ordnance factories to produce tanks and ammunition. The DPSUs & OFs had also the exclusive rights to acquire technology and manufacture. The DRDO was expected to provide indigenous designs for DPSUs and OFs to manufacture. The private sector was essentially an outsourcing agency and not a partner.
The privatization and PPP initiatives had a slow start as the DPSUs and OFs have generally been resistant to competition and treated the private sector as a pariah. The Dhirendra Singh Committee (2015) was appointed by the Modi government to improve our self-reliance quotient to 70% from the existing 30% by 2027. The report envisages a Strategic Partnership model where leading private sector entities would have equal opportunity to receive technology and forge partnerships with foreign OEMs. The FDI limit was also increased to 49% and in selected cases beyond this if they were bringing in key technologies. The offset policy also provided foreign OEMs to choose either private or public sector players as partners. In 2020, the FM also unveiled a number of initiatives for encouraging domestic manufacturing and Make in India
In the last budget, the FM proposed earmarking 25% of the R& D budget for use by the industry. She also suggested that the capital procurement budget of the services should source 68%of it from domestic sources, with or without foreign collaboration.
Impact of Reforms & Policies
Despite the slew of reform initiatives for galvanizing indigenous manufacturing, the impact of FDI policy has so far been tepid. As against $ 62. 38 billion which has come in different sectors like telecom, the FDI into defense is a measly $7 million so far. During the current year, only $3.2 million has come in as per a reply by the minister in the Lok Sabha. Similarly, despite several tweaks, the offset policy has not brought any critical technology into the country. Except for certain low-tech outsourcing orders, both PSUs and private sector have not benefited much from the offset policy, barring a few facilities which OEMs have promised. The Dhirendra Singh Committee has also not witnessed any significant spin-offs in terms of Strategic partnerships. The DRDO which is the lynchpin of indigenous design has a poor record in areas like gas turbine engines, AESA radars, passive seekers, FPAs, precision weapons, and guided bombs and carbon fibers.
The Kalam Committee in 1993 had identified the above as our key weaknesses and suggested a road map in terms of facilities and capability to rev up our SRI (Self Reliance Quotient) from 30% to 70% by 2005. It has remained a pipedream in the absence of design capacity in critical technology. Kalam had, therefore, suggested Joint Ventures with Russians for producing Brahmos cruise missiles. His vision has fructified with this JV having immense export potential, apart from meeting the huge demand for the three services. He had also mooted the idea of Joint D& D with major design houses. MR SAM, a joint D &D with the Israelis has been a great success.
On the other hand, the Joint D&D and Production program with the Russians to produce a Fifth Generation Aircraft has been shelved due to inadequate initiative from our side to make the project a success. The Services are also comfortable with imported systems, given their reliability and lethality. The indigenous designs do not give the Production Agencies to pull off such reliability. The DPSUs have in reality become assemblers of subsystems and parts instead of manufacturing at the component level. A case in point is SU 30 where our value addition after 20 years of acquiring technology is around 10% only, as against an expected indigenization of 70%. We have an ironic situation where the cost of SU 30 manufactured by HAL is more than direct import. We should have ideally made a cost-effective fighter with our MHR around 25% of Russians.
The Way Forward
Countries like China have a better record in terms of value addition than us because of their greater attention to improving factor productivity. The Nobel Laureate Robert Solow flagged the importance of total factor productivity as the gateway to increasing returns to scale. Investment in R& D and innovation plays a critical role in this process. While India spends around 0.8% of GDP on R&D, the developed economies spend 3-3.5% on it. Unlike India where the private sector players hardly spend any money on R&D, in France they spend more than 7% of their turnover on R&D. It is for this reason, both DPSUs and Private sector players play the role of assemblers and integrators.
Brazil could successfully manufacture the Embraer aircraft out of technology provided by the USA for buying F16 as an offset deal, as it pooled together all its scientific resources and provided tax holidays. China has become the manufacturing hub for F16 as they provide 100% FDI and create the enabling environment for OEMs to set up a production base and bring in key technology. In India, our prevarication in loosening FDI limit and operational flexibility to OEMs is responsible for the FDI trickle in the defense sector. We need to forge JVs with reputed OEMs and design collaboration with reputed design houses, without giving monopoly rights to DRDO in critical technology. The government would have to also seriously think in terms of privatization in aircraft like ALH, the way we are doing for surveillance vessels like OPV and IPV. The Krishnamurti Committee on National Manufacturing Zone (2011) had advised the government to make military manufacturing part of the overarching national manufacturing which will increase the share of manufacturing from 16% of GDP to 25% in a decades time and add employment opportunities of 10 million per year, We are still stuck with stagnant manufacturing and Make in India has largely remained rhetoric. It’s time for political leadership to move the manufacturing & Military Industry Complex up the ladder of Self Reliance and Value addition by conflating best global practices with India’s homegrown ingenuity.
 Please wait...
